- 安装相关包:
sudo apt install python3-numpy python3-matplotlib
- 参考代码
import sys
import cv2
import matplotlib.pyplot as plt
import numpy as np
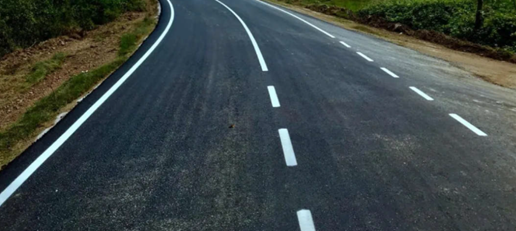
img = cv2.imread('road.png')
## 图像灰度化处理
gray_img = cv2.cvtColor(img, cv2.COLOR_BGR2GRAY)
## 图像二值化处理
# ret, dst = cv2.threshold(src, thresh, maxval, type[, dst])
# 参数:
# src: 源图像, 必须是单通道灰度图像
# thresh: 阈值
# maxval: 二值化操作中使用的最大值, 通常设为255
# type: 二值化方法
# dst: (可选)目标图像, 用于存储二值化结果
# 返回值:
# ret: 返回的阈值, 对于自动阈值方法(如cv2.THRESH_OTSU), 返回计算得到的阈值
# dst: 二值化后的图像
thresh, binary_img = cv2.threshold(gray_img, 200, 255, cv2.THRESH_BINARY)
## 图像边缘检测
# edges = cv2.Canny(image, threshold1, threshold2[, apertureSize[, L2gradient]])
# 参数:
# image: 输入图像, 通常是8位灰度图像
# threshold1: 第一个阈值, 边缘梯度值高于这个阈值的像素被视为边缘
# threshold2: 第二个阈值, 在这两个阈值之间的边缘会被认为是强边缘
# 而低于threshold1但高于threshold2的边缘被认为是弱边缘
# 只有与强边缘相连的弱边缘才会被认为是真正的边缘
# 返回值:
# edges: 边缘图像
output = cv2.Canny(binary_img, 180, 255)
## 掩码操作
# cv2.fillPoly(img, pts, color[, lineType[, shift[, offset]]])
# 参数:
# img: 原图像
# pts: 多边形的顶点坐标列表, 其中每个元素是一个二维坐标点(即顶点的坐标)
# color: 填充颜色
def mask_of_image(image):
polygons = np.array([[ (0, image.shape[0]),
(image.shape[1]//2, 100),
(image.shape[1], image.shape[0]) ]])
mask = np.zeros_like(image)
cv2.fillPoly(mask, polygons, 255)
masked_image = cv2.bitwise_and(image, mask)
return masked_image
mask_img = mask_of_image(output)
img = cv2.imread('road.png')
## 霍夫线变换, 检测直线
# cv2.HoughLinesP(image, rho, theta, threshold, lines=None, minLineLength=None, maxLineGap=None)
# 参数:
# image:通过边缘检测(如 Canny 边缘检测)处理后的图像
# rho :ρ 的步长(分辨率), ρ 是从原点到直线的垂直距离(以像素为单位)
# theta: θ 的步长(分辨率), θ 是直线的角度(以弧度为单位)
# threshold:累加器阈值, 只有那些累加器值大于阈值的直线才会被返回
# 这个值越高, 检测到的直线就越强
lines = cv2.HoughLinesP(mask_img, 1, np.pi/180, 5)
for line in lines:
x1, y1, x2, y2 = line[0]
## 车道线标注
# cv2.line(img, tuple(line[0]), tuple(line[1]), color,thickness)
# 参数:
# img : 所标注的目标图片
# line[0]: 起点坐标
# line[1]: 终点坐标
# color: 颜色
# thickness: 线宽
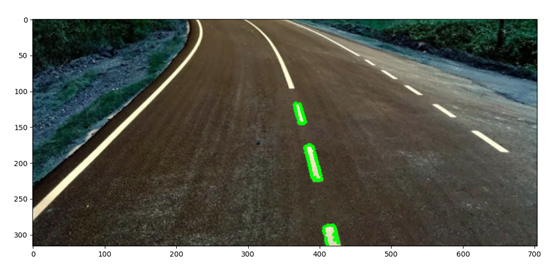
cv2.line(img, (x1, y1), (x2, y2), (0, 255, 0), 4)
plt.imshow(img)
plt.show()